Engineering Hydrology Field Visit Report
Course Information
Subject: ENCE 306 – Engineering Hydrology
Year/Part: III Year I Part
Description: Field Visit Report – Meteorological Station (DHM), covering instruments and working principles

Hydrology Field Visit Report (Meteorological Station)
Acknowledgement
Introduction
1. General Background
Hydrology and meteorology are closely interlinked disciplines. Understanding the hydrological cycle requires continuous measurement and analysis of various meteorological parameters such as precipitation, temperature, evaporation, and wind speed. The World Meteorological Organization (WMO) sets global standards for collecting such data, which the Department of Hydrology and Meteorology (DHM) implements in Nepal. To ensure meteorological data can be analyzed accurately on a global scale, measurements are recorded at specific standard times (UTC Time / Synoptic Time) rather than localized random times.
2. Objective
The main objectives of this field visit are:
- To directly observe various meteorological instruments in a real-world setting.
- To understand the working principles of these instruments and their data collection methods.
- To comprehend the differences, advantages, and working mechanisms between manual observation stations and Automatic Weather Stations (AWS).
3. Brief Introduction of the Area
The meteorological station we visited is classified as an Agro-meteorological Station (likely located in Khumaltar). Based on the available instruments and measured parameters, meteorological stations in Nepal are primarily categorized into four types:
| S.N. | Station Type | Parameters Measured |
|---|---|---|
| 1 | Precipitation Station | Rainfall only |
| 2 | Climatological Station | Rainfall and temperature |
| 3 | Agro-meteorological Station | Rainfall, temperature, wind, evaporation, soil temperature, and sunshine duration |
| 4 | Synoptic Station | All of the above + atmospheric pressure (Barometer) and cloud conditions (recorded every 3 hours) |
Instruments & Working Principles
1. Rain Gauge
This instrument is used to measure the depth of liquid precipitation in millimeters (mm).

- Working Principle: It consists of an outer cylinder and an inner measuring cylinder with a funnel placed in between. The ratio of the surface area of the outer cylinder to the inner cylinder is 1:10. This means that if 10 mm of water collects in the inner cylinder, it represents 1 mm of actual rainfall. This magnification principle allows even very small amounts of rainfall to be read easily and accurately on the measuring scale.
2. Evaporation Pan
This instrument measures the rate of water evaporation from an open surface.
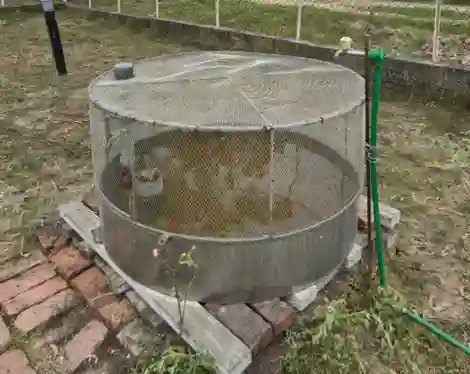
- Working Principle: It is an open pan (acting like a small pond) placed on a wooden platform to insulate it from the ground’s heat conduction. A wire mesh covers the top to prevent birds and animals from drinking the water. Because wind can cause ripples and make reading difficult, a Stilling Well is placed in the center to keep the water level steady. A Hook Micrometer attached to the well is used to measure the change in water height (initial reading vs. final reading) to determine the exact amount of evaporation.
3. Campbell-Stokes Sunshine Recorder
This device measures the number of hours in a day that sunshine exceeds a certain intensity threshold.

- Working Principle: It operates on the principle of a magnifying glass focusing sunlight to burn a piece of paper. It utilizes a solid glass sphere to focus the sun’s rays onto a special Sunshine card placed in a curved bowl behind it. As the sun moves across the sky, it leaves a continuous burn trace on the card.
4. Temperature Measurement (Stevenson Screen)
To measure the true ambient air temperature (freely moving air), thermometers are housed inside a specially designed wooden enclosure called a Stevenson Screen.
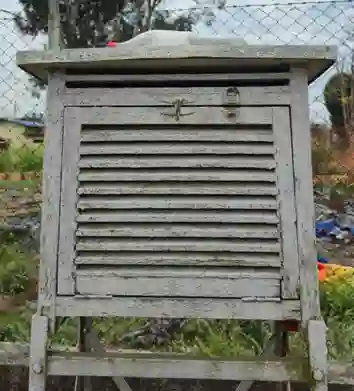
- Mounted at a standard height of 1.25 meters above the ground.
- Painted white to reflect solar radiation.
- Features wooden louvers that block direct sunlight and precipitation while allowing air to flow freely inside.
- The door is designed to open facing North so that direct sunlight does not hit the thermometers when the observer opens it.
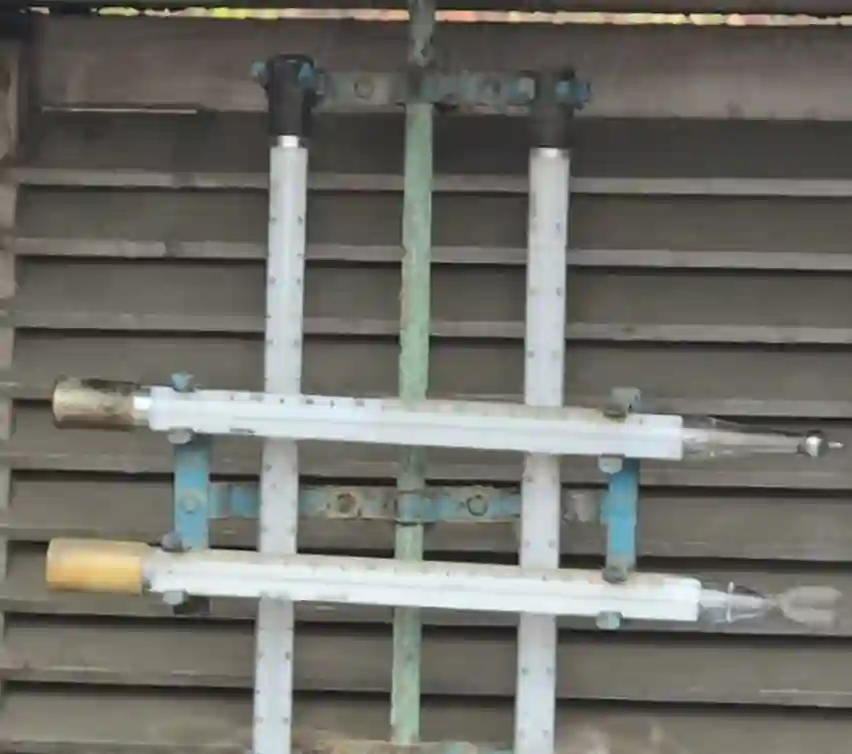
Types of Thermometers Inside:
| Thermometer | Type | What It Measures | Reset Method |
|---|---|---|---|
| Dry Bulb | Standard | Instantaneous ambient air temperature | Read directly |
| Wet Bulb | Muslin-covered bulb | Temperature based on evaporative cooling; used to derive Relative Humidity (RH) and dew point | Keep muslin wet in beaker |
| Maximum (Mercury) | Mercury with constriction | Highest temperature reached during the day | Shake and reset manually after reading |
| Minimum (Alcohol) | Alcohol-based | Lowest temperature reached overnight | Read and reset in the morning |
5. Cup Anemometer & Wind Vane
These instruments measure average wind speed and wind direction.

- Working Principle: The cup anemometer consists of three horizontal cups that rotate when the wind blows. Similar to an electric meter, it continuously rotates and accumulates a reading. The average wind speed is calculated by dividing the difference between the current day’s reading and the previous day’s reading by the time period (24 hours).
- A Wind Vane is used alongside it to determine the direction from which the wind is blowing.
6. Soil Thermometer
This measures the temperature of the soil at various depths underground.
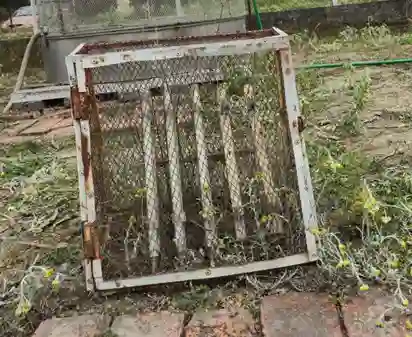
- Working Principle: Probes containing thermometers are buried in the soil at standard depths, typically at 5 cm, 10 cm, 20 cm, and 50 cm. This helps monitor the temperature profile of the ground, which is crucial for agricultural planning.
7. Automatic Weather Station (AWS)
An AWS is used to overcome the limitations of manual observation, providing real-time, continuous, and peak data without human intervention.
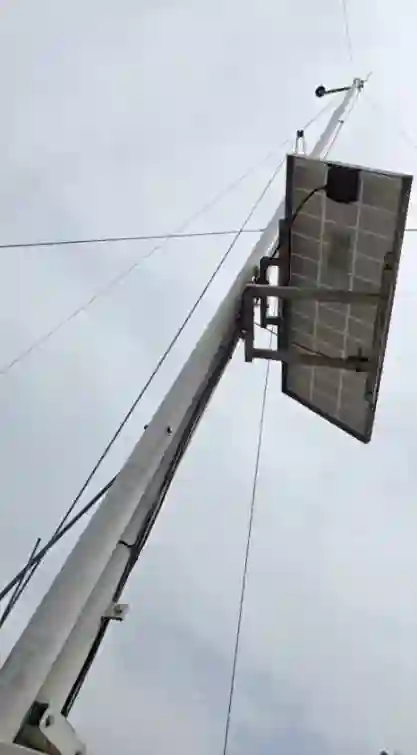
- Working Mechanism: It consists of various electronic sensors connected to a central Data Logger. The data logger continuously reads the sensors, aggregates the data, and uses a cellular modem (NTC/Ncell SIM) or satellite modem to transmit the information to a central server every 10 minutes. The system is powered by a battery charged by a solar panel.
Key Sensors of the AWS:
| Sensor | What It Measures | Working Principle / Note |
|---|---|---|
| Tipping Bucket Rain Gauge | Rainfall (digital) | Seesaw bucket tips at 0.2 mm; each tip = 1 electrical pulse counted by logger |
| PT100 Sensor | Air temperature | Change in electrical resistance of platinum wire (100 Ω); modern equivalent of Stevenson Screen setup |
| Humidity Sensor | Relative humidity | Electronic measurement of air moisture |
| Pyranometer | Global solar radiation intensity | Unlike Campbell-Stokes (duration only), gives actual intensity of solar radiation |
| Ultrasonic Wind Sensor | Wind speed & direction | Calculates based on time for sound to travel between transmitters/receivers |
| Leaf Wetness Sensor | Surface moisture on leaves | Vital for agro-meteorology and predicting plant diseases |
Observation Table: Summary of Instruments
| S.N. | Instrument | Parameter Measured | Unit | Data Collection Method | Frequency |
|---|---|---|---|---|---|
| 1 | Rain Gauge | Rainfall (Precipitation depth) | mm | Manual reading | Once daily (8:45 AM) |
| 2 | Evaporation Pan + Hook Micrometer | Evaporation | mm | Manual reading (initial vs final) | Once daily |
| 3 | Campbell-Stokes Recorder | Sunshine duration | Hours | Burn trace on card | Once daily |
| 4 | Dry Bulb Thermometer | Ambient air temperature | °C | Manual reading | At synoptic times |
| 5 | Wet Bulb Thermometer | Relative Humidity (derived) | % RH | Manual reading + tables | At synoptic times |
| 6 | Max. Thermometer (Mercury) | Maximum daily temperature | °C | Manual reading, reset by shaking | Once daily |
| 7 | Min. Thermometer (Alcohol) | Minimum daily temperature | °C | Manual reading, reset in morning | Once daily |
| 8 | Cup Anemometer + Wind Vane | Wind speed & direction | m/s, Degrees | Accumulated counter reading difference | Daily average |
| 9 | Soil Thermometer | Soil temperature at depths | °C | Manual reading at 5, 10, 20, 50 cm | Once daily |
| 10 | AWS (All sensors) | All parameters (electronic) | Various | Automatic / Data logger + Modem | Every 10 minutes |
Conclusion
This field visit provided an excellent opportunity to bridge the gap between theoretical knowledge of meteorological instruments and their practical application. We understood the critical importance of standard measurement times, specific locations, and instrument calibration in accordance with WMO guidelines. Additionally, observing the transition from traditional manual systems to Automatic Weather Stations (AWS) highlighted modern advancements in data accuracy, frequency, and real-time monitoring capabilities. The data collected from these stations forms the fundamental basis for hydrological studies, flood forecasting, climate analysis, and agricultural planning.
Disclaimer
The educational materials provided on this website are intended as supplementary resources to support your learning journey. These lab materials are sample documents designed to help students understand engineering hydrology and meteorological concepts.
We have made every effort to ensure the accuracy of the content. However, we recommend students to refer to standard lab manuals and consult with professors for authoritative explanations. These materials should be used as references only.
We respect intellectual property rights. If you believe any content should be credited differently or removed, please don’t hesitate to contact us. We’re happy to make appropriate corrections or give proper attribution.