
Class 10 Optional Mathematics Quadratic Equation
Exercise 4.1 Vertex Form and Graphs, Exercise 4.2 Graphical Solutions
35 solved questions with English and Nepali questions, SVG graphs, step by step solutions and frequently asked questions for the Nepal Grade 10 SEE.
1. Class 10 Optional Mathematics Quadratic Equation: Unit Overview and Key Formulas
Unit 4: Quadratic Equation (Optional Mathematics, Grade 10, SEE, Nepal)
Class 10 Optional Mathematics Quadratic Equation is the fourth unit of the Grade 10 Optional Mathematics course prescribed by the Curriculum Development Centre (CDC), Nepal. These class 10 optional math quadratic equation notes solve every question of Exercise 4.1 and Exercise 4.2.
Every question is written exactly as in the textbook: the main question first (Q.1, Q.2, Q.3) with its parts (a, b, c …) listed under it, and the Nepali question in brackets. Solutions are in English because the steps and symbols are the same in both languages. Graphs of Exercise 4.1 and of Exercise 4.2 Q.1 and Q.2 are drawn as SVG, and Exercise 4.2 Q.3 uses the textbook figure.
- Exercise 4.1 Quadratic Function in Vertex Form: vertex, axis of symmetry, completing the square, tables of values and translation of \(y=x^2\).
- Exercise 4.2 Solving Quadratic Equations Graphically: x-intercepts of a parabola, a parabola with a straight line, and finding the equation from a graph.
Key formulas to remember
Figure: Vertex form: y = (x − 2)² + 3 is the graph of y = x² translated 2 units right and 3 units up. The axis of symmetry is x = 2.
For more chapters, visit the complete SEE Class 10 Optional Mathematics notes. You can also read about the quadratic function for extra understanding.
2. Exercise 4.1 Quadratic Function in Vertex Form and Its Graph: Class 10 Optional Mathematics Quadratic Equation
Exercise 4.1 Quadratic Function in Vertex Form and Its Graph: Multiple Choice Questions (बहुवैकल्पिक प्रश्न)
Q.1 Tick (✓) the correct option for the given questions:
(दिइएका प्रश्नहरूको उपयुक्त विकल्पमा ठिक चिह्न (✓) लगाउनुहोस् : )
A. What are the coordinates of the turning point of the graph of the quadratic function \(y=ax^2\)? (वर्ग फलन \(y=ax^2\) को लेखाचित्र घुमेको बिन्दुको (turning point) निर्देशाङ्क कुन हो ?)
- a) \((0,0)\)
- b) \((k,0)\)
- c) \((h,k)\)
- d) \((h,0)\)
Correct Answer: a) \((0,0)\)
Solution:
- Compare \(y=ax^2\) with the vertex form \(y=a(x-h)^2+k\). We get \(h=0\) and \(k=0\).
- So the turning point (vertex) is \((0,0)\).
(\(y=ax^2\) लाई \(y=a(x-h)^2+k\) सँग तुलना गर्दा \(h=0\), \(k=0\) आउँछ । तसर्थ घुमेको बिन्दु \((0,0)\) हुन्छ ।)
B. What is the shape of the quadratic function \(y=-ax^2\) with \(a>0\)? (वर्ग फलन \(y=-ax^2,\ a>0\) को आकार कस्तो हुन्छ ?)
- a) \(\cup\)
- b) \(\cap\)
- c) \(\subset\)
- d) \(\supset\)
Correct Answer: b) \(\cap\)
Solution:
- The coefficient of \(x^2\) is \(-a<0\), so the parabola opens downwards.
- A downward-opening parabola has the shape \(\cap\).
(\(x^2\) को गुणाङ्क \(-a\) ऋणात्मक भएकाले पाराबोला तल्तिर खुल्छ र यसको आकार \(\cap\) हुन्छ ।)
C. Which one of the following lines is the line of symmetry of the parabola represented by \(y=2x^2\)? (वर्ग समीकरण \(y=2x^2\) ले दिने पाराबोला कुन रेखासँग सममितीय हुन्छ ?)
- a) X-axis (X-अक्ष)
- b) Y-axis (Y-अक्ष)
- c) \(y=0\)
- d) \(y=1\)
Correct Answer: b) Y-axis (Y-अक्ष)
Solution:
- The vertex is \((0,0)\), so the line of symmetry is \(x=h=0\).
- The line \(x=0\) is the Y-axis.
(शीर्षबिन्दु \((0,0)\) भएकाले सममितीय रेखा \(x=h=0\) हुन्छ, जुन Y-अक्ष हो ।)
D. What are the coordinates of the vertex of the quadratic function \(y=a(x-h)^2+k\)? (वर्ग फलन \(y=a(x-h)^2+k\) को शीर्षबिन्दुको निर्देशाङ्क कुन हो ?)
- a) \((0,0)\)
- b) \((k,0)\)
- c) \((h,k)\)
- d) \((h,0)\)
Correct Answer: c) \((h,k)\)
Solution:
- By the definition of the vertex form of a parabola, \((h,k)\) is the vertex.
(शीर्षबिन्दुको रूप अनुसार शीर्षबिन्दु \((h,k)\) हुन्छ ।)
E. What are the coordinates of the vertex of the parabola \(y=x^2-2x+1\)? (पाराबोला \(y=x^2-2x+1\) को शीर्षबिन्दुको निर्देशाङ्क कति हुन्छ ?)
- a) \((0,0)\)
- b) \((-1,0)\)
- c) \((1,0)\)
- d) \((1,1)\)
Correct Answer: c) \((1,0)\)
Solution:
- Convert to vertex form.
- Comparing with \(y=(x-h)^2+k\) gives \(h=1\) and \(k=0\), so the vertex is \((1,0)\).
(\(y=(x-1)^2+0\) बाट \(h=1\), \(k=0\) आउँछ । तसर्थ शीर्षबिन्दु \((1,0)\) हुन्छ ।)
Exercise 4.1 Quadratic Function in Vertex Form and Its Graph: Written Questions (लेख्ने प्रश्न)
Q.2 Convert the following quadratic equations into the vertex form \(y=(x-h)^2+k\) and sketch the graph:
- a. \(y=x^2\)
- b. \(y=2x^2\)
- c. \(y=-3x^2\)
- d. \(y=x^2+2\)
- e. \(y=x^2-5\)
- f. \(y=(x-3)^2\)
- g. \(y=(x+3)^2\)
- h. \(y=x^2+2x+1\)
- i. \(y=x^2-4x+3\)
- j. \(y=-x^2-3x+2\)
- k. \(y=x^2-x-2\)
- l. \(y=-x^2+7x+12\)
(तलका वर्ग समीकरणहरूलाई शीर्षबिन्दुको रूप \(y=(x-h)^2+k\) मा परिवर्तन गरी लेखाचित्र स्केच गर्नुहोस् : )
Step 1: Convert to vertex form
\[y=x^2=(x-0)^2+0\]Step 2: Vertex
The vertex is \((h,k)=(0,0)\).
Step 3: Table of values
\[\begin{array}{|c|c|c|c|c|c|} \hline x & -2 & -1 & 0 & 1 & 2 \\ \hline y & 4 & 1 & 0 & 1 & 4 \\ \hline \end{array}\]Step 4: Sketch the graph
Plot the points of the table and join them with a smooth curve. The parabola opens upward.
Figure: Graph of y = x² with vertex (0, 0).
Step 1: Convert to vertex form
\[y=2x^2=2(x-0)^2+0\]Step 2: Vertex
The vertex is \((h,k)=(0,0)\).
Step 3: Table of values
\[\begin{array}{|c|c|c|c|c|c|} \hline x & -2 & -1 & 0 & 1 & 2 \\ \hline y & 8 & 2 & 0 & 2 & 8 \\ \hline \end{array}\]Step 4: Sketch the graph
Plot the points of the table and join them with a smooth curve. The parabola opens upward.
Figure: Graph of y = 2x² with vertex (0, 0).
Step 1: Convert to vertex form
\[y=-3x^2=-3(x-0)^2+0\]Step 2: Vertex
The vertex is \((h,k)=(0,0)\) (opens downward).
Step 3: Table of values
\[\begin{array}{|c|c|c|c|c|c|} \hline x & -2 & -1 & 0 & 1 & 2 \\ \hline y & -12 & -3 & 0 & -3 & -12 \\ \hline \end{array}\]Step 4: Sketch the graph
Plot the points of the table and join them with a smooth curve. The parabola opens downward.
Figure: Graph of y = −3x² with vertex (0, 0).
Step 1: Convert to vertex form
\[y=x^2+2=(x-0)^2+2\]Step 2: Vertex
The vertex is \((h,k)=(0,2)\).
Step 3: Table of values
\[\begin{array}{|c|c|c|c|c|c|} \hline x & -2 & -1 & 0 & 1 & 2 \\ \hline y & 6 & 3 & 2 & 3 & 6 \\ \hline \end{array}\]Step 4: Sketch the graph
Plot the points of the table and join them with a smooth curve. The parabola opens upward.
Figure: Graph of y = x² + 2 with vertex (0, 2).
Step 1: Convert to vertex form
\[y=x^2-5=(x-0)^2-5\]Step 2: Vertex
The vertex is \((h,k)=(0,-5)\).
Step 3: Table of values
\[\begin{array}{|c|c|c|c|c|c|} \hline x & -3 & -1 & 0 & 1 & 3 \\ \hline y & 4 & -4 & -5 & -4 & 4 \\ \hline \end{array}\]Step 4: Sketch the graph
Plot the points of the table and join them with a smooth curve. The parabola opens upward.
Figure: Graph of y = x² − 5 with vertex (0, −5).
Step 1: Convert to vertex form
\[y=(x-3)^2=(x-3)^2+0\]Step 2: Vertex
The vertex is \((h,k)=(3,0)\).
Step 3: Table of values
\[\begin{array}{|c|c|c|c|c|c|} \hline x & 1 & 2 & 3 & 4 & 5 \\ \hline y & 4 & 1 & 0 & 1 & 4 \\ \hline \end{array}\]Step 4: Sketch the graph
Plot the points of the table and join them with a smooth curve. The parabola opens upward.
Figure: Graph of y = (x − 3)² with vertex (3, 0).
Step 1: Convert to vertex form
\[y=(x+3)^2=[x-(-3)]^2+0\]Step 2: Vertex
The vertex is \((h,k)=(-3,0)\).
Step 3: Table of values
\[\begin{array}{|c|c|c|c|c|c|} \hline x & -5 & -4 & -3 & -2 & -1 \\ \hline y & 4 & 1 & 0 & 1 & 4 \\ \hline \end{array}\]Step 4: Sketch the graph
Plot the points of the table and join them with a smooth curve. The parabola opens upward.
Figure: Graph of y = (x + 3)² with vertex (−3, 0).
Step 1: Convert to vertex form
\[y=x^2+2x+1=(x+1)^2=[x-(-1)]^2+0\]Step 2: Vertex
The vertex is \((h,k)=(-1,0)\).
Step 3: Table of values
\[\begin{array}{|c|c|c|c|c|c|} \hline x & -3 & -2 & -1 & 0 & 1 \\ \hline y & 4 & 1 & 0 & 1 & 4 \\ \hline \end{array}\]Step 4: Sketch the graph
Plot the points of the table and join them with a smooth curve. The parabola opens upward.
Figure: Graph of y = x² + 2x + 1 with vertex (−1, 0).
Step 1: Convert to vertex form
\[y=x^2-4x+3=(x^2-4x+4)-4+3=(x-2)^2-1\]Step 2: Vertex
The vertex is \((h,k)=(2,-1)\).
Step 3: Table of values
\[\begin{array}{|c|c|c|c|c|c|} \hline x & 0 & 1 & 2 & 3 & 4 \\ \hline y & 3 & 0 & -1 & 0 & 3 \\ \hline \end{array}\]Step 4: Sketch the graph
Plot the points of the table and join them with a smooth curve. The parabola opens upward.
Figure: Graph of y = x² − 4x + 3 with vertex (2, −1).
Step 1: Convert to vertex form
\[\begin{aligned}y &= -x^2-3x+2 \\ &= -\left(x^2+3x\right)+2 \\ &= -\left(x^2+3x+\frac{9}{4}\right)+\frac{9}{4}+2 \\ &= -\left(x+\frac{3}{2}\right)^2+\frac{17}{4}\end{aligned}\]Step 2: Vertex
The vertex is \((h,k)=(-\frac{3}{2},\frac{17}{4})\) (opens downward).
Step 3: Table of values
\[\begin{array}{|c|c|c|c|c|c|} \hline x & -3 & -2 & -1.5 & -1 & 0 \\ \hline y & 2 & 4 & 4.25 & 4 & 2 \\ \hline \end{array}\]Step 4: Sketch the graph
Plot the points of the table and join them with a smooth curve. The parabola opens downward.
Figure: Graph of y = −x² − 3x + 2 with vertex (−3/2, 17/4).
Step 1: Convert to vertex form
\[\begin{aligned}y &= x^2-x-2 \\ &= \left(x^2-x+\frac{1}{4}\right)-\frac{1}{4}-2 \\ &= \left(x-\frac{1}{2}\right)^2-\frac{9}{4}\end{aligned}\]Step 2: Vertex
The vertex is \((h,k)=(\frac{1}{2},-\frac{9}{4})\).
Step 3: Table of values
\[\begin{array}{|c|c|c|c|c|c|} \hline x & -1 & 0 & 0.5 & 1 & 2 \\ \hline y & 0 & -2 & -2.25 & -2 & 0 \\ \hline \end{array}\]Step 4: Sketch the graph
Plot the points of the table and join them with a smooth curve. The parabola opens upward.
Figure: Graph of y = x² − x − 2 with vertex (1/2, −9/4).
Step 1: Convert to vertex form
\[\begin{aligned}y &= -x^2+7x+12 \\ &= -\left(x^2-7x\right)+12 \\ &= -\left(x^2-7x+\frac{49}{4}\right)+\frac{49}{4}+12 \\ &= -\left(x-\frac{7}{2}\right)^2+\frac{97}{4}\end{aligned}\]Step 2: Vertex
The vertex is \((h,k)=(\frac{7}{2},\frac{97}{4})\) (opens downward).
Step 3: Table of values
\[\begin{array}{|c|c|c|c|c|c|} \hline x & 2 & 3 & 3.5 & 4 & 5 \\ \hline y & 22 & 24 & 24.25 & 24 & 22 \\ \hline \end{array}\]Step 4: Sketch the graph
Plot the points of the table and join them with a smooth curve. The parabola opens downward.
Figure: Graph of y = −x² + 7x + 12 with vertex (7/2, 97/4).
Q.3 Study the given quadratic equations and answer the following questions:
- a. \(x^2-4x+7=0\)
- b. \(x^2-6x+13=0\)
- c. \(x^2-8x+21=0\)
- d. \(x^2+2x-4=0\)
- e. \(x^2+2x+1=0\)
- Convert the quadratic equation into vertex form.
- Find the vertex of the parabola.
- Find the equation of the axis of symmetry.
- Show the graph as a translation of the quadratic function \(y=x^2\).
(अ) वर्ग समीकरणलाई शीर्षबिन्दुका रूपमा परिवर्तन गर्नुहोस् । (आ) पाराबोलाको शीर्षबिन्दु पत्ता लगाउनुहोस् । (इ) सममितीय अक्षको समीकरण पत्ता लगाउनुहोस् । (ई) वर्ग फलन \(y=x^2\) को स्थानान्तरणका रूपमा लेखाचित्र खिचेर देखाउनुहोस् ।)
(दिइएका वर्ग समीकरणहरूको अध्ययन गरी निम्नलिखित प्रश्नहरूको उत्तर दिनुहोस् : )
(i) Convert into vertex form (completing the square)
\[y=x^2-4x+7=(x^2-4x+4)+3=(x-2)^2+3\](ii) Vertex of the parabola
Comparing with \(y=(x-h)^2+k\) gives \((h,k)=(2,3)\).
(iii) Equation of the axis of symmetry
\(x=h\), so \(x=2\).
(iv) Graph as a translation of \(y=x^2\)
The graph is \(y=x^2\) translated 2 units to the right and 3 units upward.
Figure: The graph of y = (x − 2)² + 3 is the graph of y = x² translated 2 right, 3 up.
(i) Convert into vertex form (completing the square)
\[y=x^2-6x+13=(x^2-6x+9)+4=(x-3)^2+4\](ii) Vertex of the parabola
Comparing with \(y=(x-h)^2+k\) gives \((h,k)=(3,4)\).
(iii) Equation of the axis of symmetry
\(x=h\), so \(x=3\).
(iv) Graph as a translation of \(y=x^2\)
The graph is \(y=x^2\) translated 3 units to the right and 4 units upward.
Figure: The graph of y = (x − 3)² + 4 is the graph of y = x² translated 3 right, 4 up.
(i) Convert into vertex form (completing the square)
\[y=x^2-8x+21=(x^2-8x+16)+5=(x-4)^2+5\](ii) Vertex of the parabola
Comparing with \(y=(x-h)^2+k\) gives \((h,k)=(4,5)\).
(iii) Equation of the axis of symmetry
\(x=h\), so \(x=4\).
(iv) Graph as a translation of \(y=x^2\)
The graph is \(y=x^2\) translated 4 units to the right and 5 units upward.
Figure: The graph of y = (x − 4)² + 5 is the graph of y = x² translated 4 right, 5 up.
(i) Convert into vertex form (completing the square)
\[y=x^2+2x-4=(x^2+2x+1)-5=(x+1)^2-5\](ii) Vertex of the parabola
Comparing with \(y=(x-h)^2+k\) gives \((h,k)=(-1,-5)\).
(iii) Equation of the axis of symmetry
\(x=h\), so \(x=-1\).
(iv) Graph as a translation of \(y=x^2\)
The graph is \(y=x^2\) translated 1 unit to the left and 5 units downward.
Figure: The graph of y = (x + 1)² − 5 is the graph of y = x² translated 1 left, 5 down.
Note on the printed equation
The question is printed as \(x^2+2x+1=0\), but the textbook answer key gives the vertex \((-2,-3)\), which belongs to \(x^2+4x+1\). The main solution below follows the answer key. For the printed equation \(y=x^2+2x+1=(x+1)^2\), the vertex form is \(y=(x+1)^2+0\), the vertex is \((-1,0)\), the axis of symmetry is \(x=-1\), and the graph is \(y=x^2\) translated \(1\) unit to the left.
(i) Convert into vertex form (completing the square)
\[y=x^2+4x+1=(x^2+4x+4)-3=(x+2)^2-3\](ii) Vertex of the parabola
Comparing with \(y=(x-h)^2+k\) gives \((h,k)=(-2,-3)\).
(iii) Equation of the axis of symmetry
\(x=h\), so \(x=-2\).
(iv) Graph as a translation of \(y=x^2\)
The graph is \(y=x^2\) translated 2 units to the left and 3 units downward.
Figure: The graph of y = (x + 2)² − 3 is the graph of y = x² translated 2 left, 3 down.
Figure: Variant for the printed equation x² + 2x + 1: y = x² translated 1 unit to the left.
3. Exercise 4.2 Solving Quadratic Equations Graphically: Class 10 Optional Mathematics Quadratic Equation
Exercise 4.2 Solving Quadratic Equations Graphically: Written Questions (लेख्ने प्रश्न)
Q.1 Solve the given equations by graphical method.
- a. \(x^2+2x-3=0\)
- b. \(x^2-5x+6=0\)
- c. \(x^2-4x+3=0\)
- d. \(2x^2-7x+3=0\)
- e. \(x^2-3x-10=0\)
(लेखाचित्र विधिद्वारा दिइएका समीकरणहरूको हल गर्नुहोस् : )
Step 1: Let \(y=f(x)\)
\[y=x^2+2x-3=(x+1)^2-4\]The vertex is \((-1,-4)\).
Step 2: Table of values
\[\begin{array}{|c|c|c|c|c|c|} \hline x & -3 & -2 & -1 & 0 & 1 \\ \hline y & 0 & -3 & -4 & -3 & 0 \\ \hline \end{array}\]Step 3: Read the x-intercepts (where \(y=0\))
- At \(x=1\), \(y=0\).
- At \(x=-3\), \(y=0\).
The parabola cuts the \(x\)-axis at these points.
Figure: Graph of y = x² + 2x − 3 cutting the x-axis at x = −3 and x = 1.
Step 1: Let \(y=f(x)\)
\[\begin{aligned}y &= x^2-5x+6 \\ &= \left(x-\frac{5}{2}\right)^2-\frac{1}{4}\end{aligned}\]The vertex is \(\left(\frac{5}{2},-\frac{1}{4}\right)\).
Step 2: Table of values
\[\begin{array}{|c|c|c|c|c|c|} \hline x & 0 & 1 & 2 & 3 & 4 \\ \hline y & 6 & 2 & 0 & 0 & 2 \\ \hline \end{array}\]Step 3: Read the x-intercepts (where \(y=0\))
- At \(x=2\), \(y=0\).
- At \(x=3\), \(y=0\).
The parabola cuts the \(x\)-axis at these points.
Figure: Graph of y = x² − 5x + 6 cutting the x-axis at x = 2 and x = 3.
Step 1: Let \(y=f(x)\)
\[y=x^2-4x+3=(x-2)^2-1\]The vertex is \((2,-1)\).
Step 2: Table of values
\[\begin{array}{|c|c|c|c|c|c|} \hline x & 0 & 1 & 2 & 3 & 4 \\ \hline y & 3 & 0 & -1 & 0 & 3 \\ \hline \end{array}\]Step 3: Read the x-intercepts (where \(y=0\))
- At \(x=1\), \(y=0\).
- At \(x=3\), \(y=0\).
The parabola cuts the \(x\)-axis at these points.
Figure: Graph of y = x² − 4x + 3 cutting the x-axis at x = 1 and x = 3.
Step 1: Let \(y=f(x)\)
\[\begin{aligned}y &= 2x^2-7x+3 \\ &= 2\left(x-\frac{7}{4}\right)^2-\frac{25}{8}\end{aligned}\]The vertex is \(\left(\frac{7}{4},-\frac{25}{8}\right)\).
Step 2: Table of values
\[\begin{array}{|c|c|c|c|c|c|} \hline x & 0 & 0.5 & 1 & 2 & 3 \\ \hline y & 3 & 0 & -2 & -3 & 0 \\ \hline \end{array}\]Step 3: Read the x-intercepts (where \(y=0\))
- At \(x=\frac{1}{2}\), \(y=0\).
- At \(x=3\), \(y=0\).
The parabola cuts the \(x\)-axis at these points.
Figure: Graph of y = 2x² − 7x + 3 cutting the x-axis at x = 1/2 and x = 3.
Step 1: Let \(y=f(x)\)
\[\begin{aligned}y &= x^2-3x-10 \\ &= \left(x-\frac{3}{2}\right)^2-\frac{49}{4}\end{aligned}\]The vertex is \(\left(\frac{3}{2},-\frac{49}{4}\right)\).
Step 2: Table of values
\[\begin{array}{|c|c|c|c|c|c|} \hline x & -2 & 0 & 1.5 & 3 & 5 \\ \hline y & 0 & -10 & -12.25 & -10 & 0 \\ \hline \end{array}\]Step 3: Read the x-intercepts (where \(y=0\))
- At \(x=-2\), \(y=0\).
- At \(x=5\), \(y=0\).
The parabola cuts the \(x\)-axis at these points.
Figure: Graph of y = x² − 3x − 10 cutting the x-axis at x = −2 and x = 5.
Q.2 Solve the given pair of equations by graphical method:
- a. \(y=x^2\) and \(y=x+2\)
- b. \(y=x^2-x-3\) and \(x-y=0\)
- c. \(y=6x^2-2x-15\) and \(y=4x-3\)
- d. \(y=x^2-2x\) and \(y=x+4\)
(दिइएका जोडी समीकरणहरूलाई लेखाचित्रद्वारा हल गर्नुहोस् : )
Step 1: Table of values for the parabola \(y=x^2\)
\[\begin{array}{|c|c|c|c|c|c|c|} \hline x & -2 & -1 & 0 & 1 & 2 & 3 \\ \hline y & 4 & 1 & 0 & 1 & 4 & 9 \\ \hline \end{array}\]Step 2: Table of values for \(y=x+2\)
\[\begin{array}{|c|c|c|c|} \hline x & -1 & 0 & 2 \\ \hline y & 1 & 2 & 4 \\ \hline \end{array}\]Step 3: Draw both graphs and find where they meet
Equate the two expressions to confirm the intersection points:
\[\begin{aligned}& x^2=x+2 \\ &\implies x^2-x-2=0 \\ &\implies (x-2)(x+1)=0 \\ &\implies x=2,\,-1\end{aligned}\]Substitute each \(x\) in the straight line to get \(y\).
Figure: Graph of y = x² and y = x + 2; the curves meet at (2, 4) and (−1, 1).
Step 1: Table of values for the parabola \(y=x^2-x-3\)
\[\begin{array}{|c|c|c|c|c|c|c|c|} \hline x & -2 & -1 & 0 & 1 & 2 & 3 & 4 \\ \hline y & 3 & -1 & -3 & -3 & -1 & 3 & 9 \\ \hline \end{array}\]Step 2: Table of values for \(x-y=0\)
\[\begin{array}{|c|c|c|c|} \hline x & -1 & 0 & 3 \\ \hline y & -1 & 0 & 3 \\ \hline \end{array}\]Step 3: Draw both graphs and find where they meet
Equate the two expressions to confirm the intersection points:
\[\begin{aligned}& x^2-x-3=x \\ &\implies x^2-2x-3=0 \\ &\implies (x-3)(x+1)=0 \\ &\implies x=3,\,-1\end{aligned}\]Substitute each \(x\) in the straight line to get \(y\).
Figure: Graph of y = x² − x − 3 and y = x; the curves meet at (3, 3) and (−1, −1).
Step 1: Table of values for the parabola \(y=6x^2-2x-15\)
\[\begin{array}{|c|c|c|c|c|} \hline x & -1 & 0 & 1 & 2 \\ \hline y & -7 & -15 & -11 & 5 \\ \hline \end{array}\]Step 2: Table of values for \(y=4x-3\)
\[\begin{array}{|c|c|c|c|} \hline x & -1 & 0 & 2 \\ \hline y & -7 & -3 & 5 \\ \hline \end{array}\]Step 3: Draw both graphs and find where they meet
Equate the two expressions to confirm the intersection points:
\[\begin{aligned}& 6x^2-2x-15=4x-3 \\ &\implies 6x^2-6x-12=0 \\ &\implies x^2-x-2=0 \\ &\implies (x-2)(x+1)=0 \\ &\implies x=2,\,-1\end{aligned}\]Substitute each \(x\) in the straight line to get \(y\).
Figure: Graph of y = 6x² − 2x − 15 and y = 4x − 3; the curves meet at (2, 5) and (−1, −7).
Step 1: Table of values for the parabola \(y=x^2-2x\)
\[\begin{array}{|c|c|c|c|c|c|c|c|} \hline x & -2 & -1 & 0 & 1 & 2 & 3 & 4 \\ \hline y & 8 & 3 & 0 & -1 & 0 & 3 & 8 \\ \hline \end{array}\]Step 2: Table of values for \(y=x+4\)
\[\begin{array}{|c|c|c|c|} \hline x & -1 & 0 & 4 \\ \hline y & 3 & 4 & 8 \\ \hline \end{array}\]Step 3: Draw both graphs and find where they meet
Equate the two expressions to confirm the intersection points:
\[\begin{aligned}& x^2-2x=x+4 \\ &\implies x^2-3x-4=0 \\ &\implies (x-4)(x+1)=0 \\ &\implies x=4,\,-1\end{aligned}\]Substitute each \(x\) in the straight line to get \(y\).
Figure: Graph of y = x² − 2x and y = x + 4; the curves meet at (4, 8) and (−1, 3).
Q.3 Find the equation of the given parabolas:
- a. Graph (a) in the figure below
- b. Graph (b) in the figure below
- c. Graph (c) in the figure below
- d. Graph (d) in the figure below
(दिइएका पाराबोलाहरूको समीकरण पत्ता लगाउनुहोस् : )
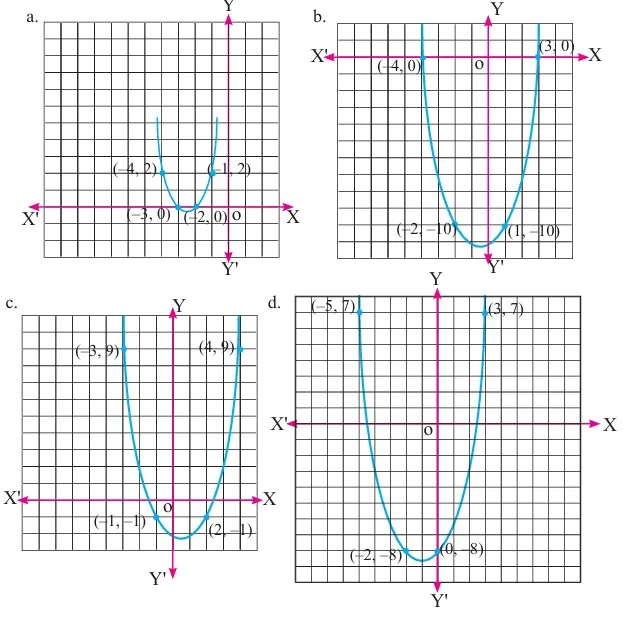
Points read from the graph
\((-3,0), (-2,0), (-4,2), (-1,2)\)
Step 1: General equation
Let \(y=ax^2+bx+c\). The graph passes through \((-3,0)\), \((-2,0)\), \((-4,2)\) and \((-1,2)\).
Step 2: Form equations
\[(-3,0):\ 9a-3b+c=0 \qquad \text{(i)}\]\[(-2,0):\ 4a-2b+c=0 \qquad \text{(ii)}\]Subtract (ii) from (i):
\[5a-b=0 \implies b=5a\]Substitute \(b=5a\) in (ii): \(4a-10a+c=0\), so \(c=6a\).
Step 3: Use \((-4,2)\)
\[\begin{aligned}& 16a-4(5a)+6a=2 \\ &\implies 2a=2 \\ &\implies a=1\end{aligned}\]Hence \(a=1\), \(b=5\), \(c=6\).
Points read from the graph
\((-4,0), (3,0), (-2,-10), (1,-10)\)
Step 1: Use the x-intercepts
The graph cuts the \(x\)-axis at \((-4,0)\) and \((3,0)\), so \(y=a(x+4)(x-3)\).
Step 2: Use the point \((1,-10)\)
\[\begin{aligned}& -10=a(1+4)(1-3) \\ &\implies -10=-10a \\ &\implies a=1\end{aligned}\]Step 3: Expand
\[y=(x+4)(x-3)=x^2+x-12\]Points read from the graph
\((-3,9), (4,9), (-1,-1), (2,-1)\)
Step 1: General equation
Let \(y=ax^2+bx+c\). The graph passes through \((-1,-1)\), \((2,-1)\) and \((-3,9)\) (the point \((4,9)\) is its mirror image).
Step 2: Form equations
- \((-1,-1)\): \(a-b+c=-1\) (i)
- \((2,-1)\): \(4a+2b+c=-1\) (ii)
- \((-3,9)\): \(9a-3b+c=9\) (iii)
Subtract (i) from (ii):
\[3a+3b=0 \implies b=-a\]From (i): \(a+a+c=-1\), so \(c=-1-2a\).
Step 3: Use (iii)
\[\begin{aligned}& 9a+3a+(-1-2a)=9 \\ &\implies 10a=10 \\ &\implies a=1\end{aligned}\]Hence \(a=1\), \(b=-1\), \(c=-3\). Check: the axis of symmetry is \(x=\frac{-1+2}{2}=\frac{1}{2}=-\frac{b}{2a}\).
Points read from the graph
\((-5,7), (3,7), (-2,-8), (0,-8)\)
Step 1: General equation
Let \(y=ax^2+bx+c\). The graph passes through \((-5,7)\), \((3,7)\), \((-2,-8)\) and \((0,-8)\).
Step 2: Use \((0,-8)\)
\(c=-8\).
Step 3: Use \((-2,-8)\)
\[\begin{aligned}& 4a-2b-8=-8 \\ &\implies 4a-2b=0 \\ &\implies b=2a\end{aligned}\]Step 4: Use \((3,7)\)
\[\begin{aligned}& 9a+3(2a)-8=7 \\ &\implies 15a=15 \\ &\implies a=1\end{aligned}\]Hence \(a=1\), \(b=2\), \(c=-8\).
4. Frequently Asked Questions on Class 10 Optional Mathematics Quadratic Equation
What is covered in Class 10 Optional Mathematics Quadratic Equation (Unit 4)? (कक्षा १० ऐच्छिक गणित वर्ग समीकरण (एकाइ ४) मा के के समावेश छ ?)
Class 10 Optional Mathematics Quadratic Equation is Unit 4 of the Grade 10 Optional Mathematics book of Nepal. Exercise 4.1 covers the vertex form, vertex, axis of symmetry and translation of the parabola. Exercise 4.2 covers solving quadratic equations and simultaneous equations graphically and finding the equation of a parabola from its graph. This page solves all 35 questions.
What is the vertex form of a quadratic function? (वर्ग फलनको शीर्षबिन्दुको रूप (vertex form) भनेको के हो ?)
The vertex form is \(y=a(x-h)^2+k\). Its graph is a parabola with vertex \((h,k)\) and axis of symmetry \(x=h\). The parabola opens upward if \(a>0\) and downward if \(a<0\).
How do I convert a quadratic equation into vertex form? (वर्ग समीकरणलाई शीर्षबिन्दुको रूपमा कसरी बदल्ने ?)
Use completing the square. Take the first two terms, add and subtract the square of half the coefficient of \(x\).
Example: \(x^2-4x+7=(x^2-4x+4)+3=(x-2)^2+3\), so the vertex is \((2,3)\) (Exercise 4.1, Question 3a).
How do I find the vertex and the axis of symmetry? (शीर्षबिन्दु र सममितीय अक्ष कसरी पत्ता लगाउने ?)
After writing \(y=a(x-h)^2+k\), the vertex is \((h,k)\) and the axis of symmetry is \(x=h\). For \(y=ax^2\) the vertex is \((0,0)\) and the axis is the Y-axis.
How do I show a parabola as a translation of \(y=x^2\)? (पाराबोलालाई \(y=x^2\) को स्थानान्तरणका रूपमा कसरी देखाउने ?)
Write it as \(y=(x-h)^2+k\). The graph of \(y=x^2\) is moved \(h\) units to the right (left if \(h\) is negative) and \(k\) units up (down if \(k\) is negative).
How do I draw a quadratic graph from a table of values? (मानको तालिकाबाट वर्ग फलनको लेखाचित्र कसरी खिच्ने ?)
- Find the vertex and choose \(x\)-values on both sides of it.
- Calculate the \(y\)-values and make a table.
- Plot the points and join them with a smooth curve.
How do I solve a quadratic equation by the graphical method? (वर्ग समीकरणलाई लेखाचित्र विधिद्वारा कसरी हल गर्ने ?)
Let \(y\) equal the left side, draw the parabola, and read the \(x\)-coordinates of the points where it cuts the \(x\)-axis (\(y=0\)). Example: \(x^2+2x-3=0\) gives \(x=1,\,-3\) (Exercise 4.2, Question 1a).
How do I solve a parabola and a straight line graphically? (पाराबोला र सिधा रेखाको जोडी समीकरण लेखाचित्रद्वारा कसरी हल गर्ने ?)
Draw both graphs on the same axes. The coordinates of the points where they meet are the solutions. You can check by equating the two expressions, for example \(x^2=x+2\) gives the points \((2,4)\) and \((-1,1)\) (Exercise 4.2, Question 2a).
How do I find the equation of a parabola from its graph? (लेखाचित्रबाट पाराबोलाको समीकरण कसरी पत्ता लगाउने ?)
If the graph cuts the \(x\)-axis at \(x_1\) and \(x_2\), use \(y=a(x-x_1)(x-x_2)\) and find \(a\) from another point. Otherwise use \(y=ax^2+bx+c\) with three points and solve for \(a,\,b,\,c\).
Are these questions useful for SEE preparation in Nepal? (के यी प्रश्नहरू नेपालमा SEE को तयारीका लागि उपयोगी छन् ?)
Yes, for students who study Optional Mathematics. This set covers every question type of Exercises 4.1 and 4.2: vertex form, translation of parabolas, graphical solutions and finding equations from graphs. Practising them builds the skills needed for SEE-style questions.
Are the solutions available in Nepali? (के समाधान नेपाली भाषामा पनि उपलब्ध छन् ?)
Every question is shown in English with the Nepali question in brackets. Multiple choice solutions also have Nepali in brackets. All other solutions are in English only, because the steps and symbols of mathematics are the same in both languages.
Students also search for:
Also Read
- SEE Class 10 Optional Mathematics Notes (all chapters)
- SEE Class 10 Compulsory Mathematics Notes
- SEE Class 10 Science Notes
- Class 10 English Notes (SEE Nepal)
- Nepali Class 10 Vyakaran SEE Notes
- SEE Class 10 Social Studies Notes
- SEE Class 10 Computer Science Notes
- Class 10 Account SEE Notes
- Class 10 Education Notes
- Class 10 Economics Guide