

Report: Testing of a Beam in Combined Bending and Shear
1. Objectives
- i. To analyze the modes of failure and loading criteria.
- ii. To compare the theoretical value and experimental value of shear taken by the design section.
- iii. To compare the moment of resistance obtained theoretically and experimentally.
2. Theory
Shear failure occurs under the combined action of shearing force and bending moments and is characterized by very small deflection and lack of ductility. The failure is sudden and occurs without warning. For this reason, shear failure is considered undesirable and is usually avoided as far as possible by proper detailing. Hence, it is very important to understand and analyze the shear failure phenomenon.
Change in bending moment along the span of a beam causes shear stresses and, hence, shear force. The load at which diagonal cracks form is typically taken as the strength of the beam in shear. An exact analysis of shear in reinforced concrete beams is quite complex, but extensive experimental studies have revealed that the shear force is resisted by the beam through a combination of the following components:
-
i.
Dowel Action: Shear resisted by the dowel action of the flexural reinforcement, known as dowel shear capacity (15% to 30%).
-
ii.
Aggregate Interlocking: Shear carried by the critical component of the interface along the crack due to aggregate interlocking (35% to 50%).
-
iii.
Uncracked Concrete: Shear resisted by the uncracked concrete in the compression zone (20% to 40%).
The Nominal Shear Stress Formula:
3. Materials and Apparatus
Materials Required
- • Cement
- • Sand
- • Aggregate
- • Water
- • Steel rods:
- Tensile reinforcement = 2 nos. of 10 mm \(\phi\)
- Compression reinforcement = 2 nos. of 8 mm \(\phi\)
- Vertical stirrups = 3 nos. of 6 mm \(\phi\)
Apparatus Required
- • Beam and cube Moulds
- • Universal Testing Machine
- • Shovel
- • Vibrator
- • Hack-saw and bending arrangement
- • Measuring Tape and weighing machine
4. Procedure
- The formwork was cleaned, assembled, and greased uniformly on the inside.
- Steel bars and stirrups were cut and bent as per design requirements.
- The longitudinal bars and stirrups were fixed properly to form a rebar cage.
- The concrete mix was prepared and mixed properly by taking the calculated amount of cement, sand, aggregate, and water.
- The mix was placed in the formwork and properly compacted using a vibrator.
- The cast specimens were allowed to set for 24 hours. After demoulding, they were cured for 28 days before testing was conducted.
5. Observation and Calculations
Material Mix Design Calculation
Given Parameters:
- Mix Proportion: 1:1.5:3
- W/C Ratio: 0.45
- Density of PCC: 24 kN/m³ = 2400 kg/m³
Volume Computations:
Total wet volume:
Weight Required = \(0.041625 \times 2400 = 99.9\text{ kg}\)
Theoretical Weight Calculations:
Cement Required:
- Sand: \(1.5 \times 16.79 = 25.185\text{ kg}\)
- Gravel: \(3 \times 16.79 = 50.37\text{ kg}\)
- Water: \(0.45 \times 16.79 = 7.55\text{ kg}\)
Actual Batch Weights Taken:
Cement
20 kg
Sand
30 kg
Gravel
60 kg
Water
10 kg
5.2 Experimental Observations
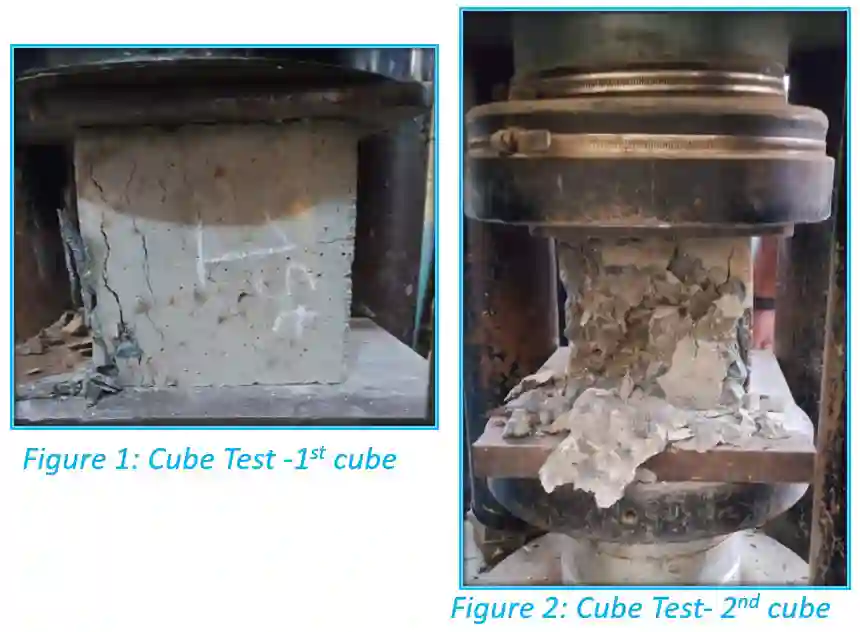
Concrete Cubes Test Data (28 Days)
| Test Period | Cube No. | Weight (kg) | Failure Load (kN) | Compressive Strength (MPa) |
|---|---|---|---|---|
| 28 Days | 1 | 8.235 | 643.2 | 28.58 |
| 2 | 8.415 | 444.8 | 19.76 | |
| 3 | 8.200 | 666.2 | 29.60 | |
| Mean | – | 584.73 | 25.98 |
Beam Combined Test Data
| Beam No. | Crack Width (mm) | First Crack Load (kN) | Failure Load P (kN) |
|---|---|---|---|
| 1 | 3.5 mm | 28.5 | 76.4 |
5.3 Theoretical vs. Experimental Computations
Section & Material Properties:
- Effective Span (L): 600 mm
- Breadth (b) & Depth (D): 150 mm × 150 mm
- Effective Depth (d): 150 – 25 – (10/2) = 120 mm
- Tensile Steel (2x10mm φ): Ast = 157.08 mm²
- Stirrups (3x6mm φ): Asv = 56.55 mm² @ 150mm c/c
- Concrete (fck) & Steel (fy): 20 MPa & 500 MPa
Shear Capacity Analysis
Percentage of tension steel (pt) = 0.87%. By interpolating Table 19 of IS 456, τc ≈ 0.59 N/mm².
Experimental Shear (\(V_{exp} = P/2\)):
38.2 kN
Moment Capacity Analysis
Neutral axis depth \(x_u = 63.26\text{ mm} > x_{u,max} (55.2\text{ mm})\). Section is over-reinforced. Limiting moment:
Experimental Moment (\(M_{exp} = P \cdot L/6\)):
7.64 kNm
6. Results Summary
Mean Compressive Strength
25.98 MPa
Ultimate Failure Load (P)
76.4 kN
Experimental Shear Capacity
38.2 kN (vs 20.46 kN theory)
Experimental Moment Capacity
7.64 kNm (vs 5.75 kNm theory)
7. Discussion and Conclusion
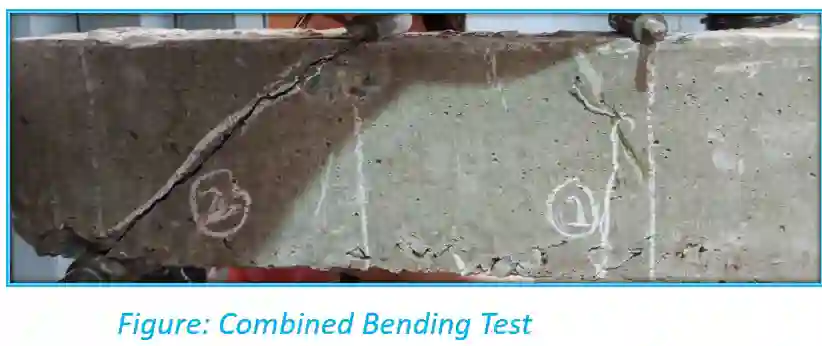
The beam tested under combined bending and shear exhibited a complex failure mechanism. Both the experimental shear capacity (38.2 kN) and experimental moment capacity (7.64 kNm) were significantly higher than the theoretical limits derived using IS 456:2000. This reserve strength is largely attributable to the actual concrete compressive strength (25.98 MPa) far exceeding the M20 design assumption, as well as the inherent conservative nature of code-based aggregate interlock and dowel action formulas.
As loads increased past the first crack at 28.5 kN, flexural cracks initiated in the mid-span tension zone. Concurrently, diagonal tension cracks formed near the supports and propagated rapidly toward the loading points, indicating a mixed flexure-shear mode of failure. A maximum crack width of 3.5 mm was recorded before ultimate collapse. The test successfully fulfilled the objectives of analyzing failure modes and directly comparing experimental resistance against theoretical design sections.