Class 10 Economics
Chapter 1 Revenue and Revenue Curves
For SEE board exam preparation: Complete theoretical notes, graphs, fully solved textbook exercises and numerical problems
Welcome to the complete study guide on Chapter 1 Revenue and Revenue Curves under Microeconomics. This is Chapter 1 of Unit 2 for Class 10 Economics students in Nepal preparing for their SEE board exams.
Here you will find structured notes on Total Revenue (TR), Average Revenue (AR), and Marginal Revenue (MR), clear illustrations of Perfect Competition and Monopoly revenue curves, fully solved textbook exercises, and additional numerical problems with step-by-step solutions.
Explore our complete study list here: Class 10 Economics Notes.
1. Theoretical Concepts
Introduction to Revenue
Revenue refers to the monetary amount received by a producer or seller from selling goods and services. The concept of revenue includes only the money received from the sale of goods and services. In this unit, we will study Total Revenue, Average Revenue, and Marginal Revenue — along with their curves — under both the Perfect Competition market and the Monopoly market.
(A) Concept of Total, Average and Marginal Revenue
The concept of revenue is studied by dividing it into three parts: Total Revenue, Average Revenue, and Marginal Revenue.
Total Revenue (TR)
The total amount of money received from selling the total quantity of goods and services within a given time period is called Total Revenue (TR). In other words, it is obtained by multiplying the price per unit (P) of the good by the total quantity sold (Q). It can also be calculated as the sum of all marginal revenues. The formula for Total Revenue is expressed as follows:
Total Revenue (TR) = Price (P) × Quantity Sold (Q)
That is, $$TR = P \times Q$$ or, $$TR = \Sigma{MR}$$ where $\Sigma{MR}$ = sum of marginal revenues
Example: A farmer produces 50 chicks and sells each at Rs. 100.
$$TR = P \times Q$$
$$TR = 100 \times 50$$
$$\therefore TR = \text{Rs. } 5{,}000$$
Average Revenue (AR)
The revenue obtained by dividing Total Revenue by the quantity sold is called Average Revenue (AR). It is the revenue earned per unit of goods and services sold, and is also referred to as the per-unit selling price. The formula is expressed as:
Average Revenue (AR) = Total Revenue (TR) ÷ Total Quantity Sold (Q)
$$AR = \frac{TR}{Q} = \frac{P \times Q}{Q} = P$$
Since Average Revenue equals the price of the good, $AR = P$.
Example: The farmer sells 50 chicks at Rs. 100 each, earning a Total Revenue of Rs. 5,000.
$$AR = \frac{TR}{Q} = \frac{5{,}000}{50}$$
$$\therefore AR = \text{Rs. } 100$$
Marginal Revenue (MR)
The additional change in Total Revenue that occurs when a producer or seller sells one additional unit of goods or services is called Marginal Revenue (MR). In other words, it is the extra income received from selling one more unit. Marginal Revenue is also the ratio of the change in Total Revenue to the change in the quantity sold. The formula is:
Marginal Revenue (MR) = Change in Total Revenue (ΔTR) ÷ Change in Quantity Sold (ΔQ)
$$MR = \frac{\Delta TR}{\Delta Q} = \frac{TR_n – TR_{n-1}}{Q_n – Q_{n-1}}$$
where,
$TR_n$ = Total Revenue of the succeeding unit
$TR_{n-1}$ = Total Revenue of the preceding unit
$Q_n$ = Succeeding unit
$Q_{n-1}$ = Preceding unit
Example: The farmer earns TR = Rs. 5,000 by selling 50 chicks. If selling 51 chicks raises TR to Rs. 5,100:
$$MR = \frac{\Delta TR}{\Delta Q} = \frac{5{,}100 – 5{,}000}{51 – 50} = \frac{100}{1}$$
$$\therefore MR = \text{Rs. } 100$$
(B) Perfect Competition Market and Revenue Curves
A perfect competition market is a market with a large number of buyers and sellers. In such a market, every seller or firm produces and sells identical (homogeneous) goods. All goods and services are bought and sold at the same price throughout the market. No single buyer or seller can exert undue influence on the market price. Since firms sell goods freely at a fixed market price, there is no direct rivalry between individual firms. In reality, a market structure with all these features perfectly does not exist in the real world.
According to A. Koutsoyiannis: “Perfect competition is a market structure characterised by a complete absence of rivalry among individual firms.”
Features of the Perfect Competition Market
- Large Number of Buyers and Sellers: There are a very large number of buyers and sellers in a perfectly competitive market. All buyers and sellers freely buy and sell goods and services without any single party influencing the price.
- Homogeneous Product: Every firm in a perfectly competitive market produces goods and services that are identical in price, quantity, quality, and size. There is complete uniformity among all products sold.
- Perfect Knowledge of the Market: Both buyers and sellers have complete information about the market — including prices, quality, quantities, and durability of goods.
- Perfect Mobility of Factors of Production: The factors of production — labour and capital — are perfectly mobile. They can freely move from one firm to another or from one location to another, depending on opportunities and conditions available in the market.
- No Government Intervention: The government does not interfere in a perfectly competitive market. The price of goods and services is determined entirely by the interaction of market demand and supply.
- Free Entry and Exit: Firms are free to enter or exit the industry at any time. New firms can enter the industry when existing firms are earning high profits, and can exit when losses are being incurred.
Revenue and Revenue Curves under Perfect Competition
In a perfectly competitive market, the price of a good is constant. Every seller sells varying quantities at the same fixed price per unit. Because the price remains constant, Total Revenue increases at a steady rate as quantity sold increases, while Average Revenue and Marginal Revenue remain constant and equal to each other. Since each individual producer supplies only a tiny portion of the total market, no single firm can influence the market price.
The Total, Average, and Marginal Revenue curves under perfect competition are presented in the diagram below.
Diagram 1.1: Revenue Curves under Perfect Competition Market
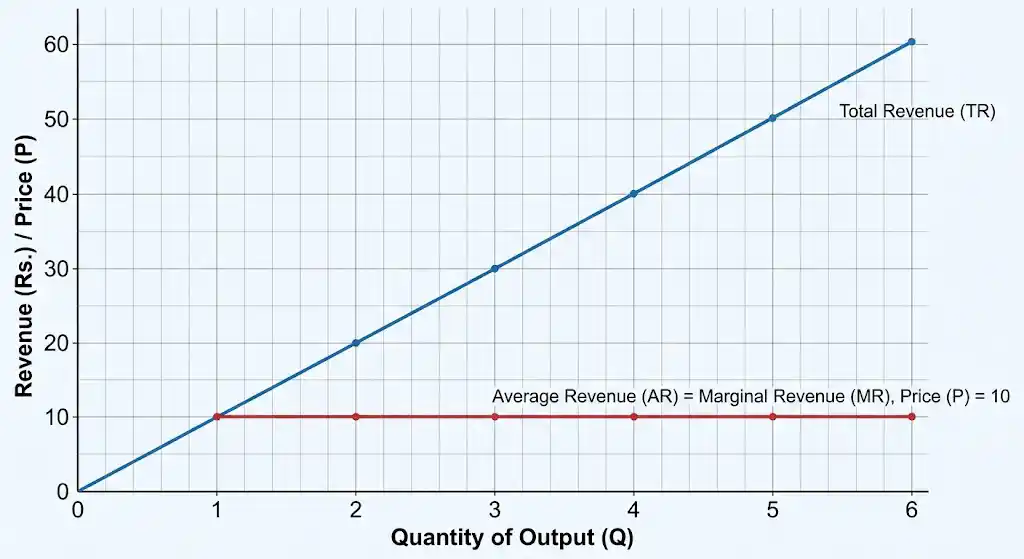
In Diagram 1.1, the quantity sold is measured on the X-axis and Total, Average, and Marginal Revenue are measured on the Y-axis. As the quantity sold increases, the Total Revenue curve rises at a constant rate. The Average Revenue and Marginal Revenue lines are both parallel to the X-axis and, since they are equal to each other, they overlap completely.
Nature of TR, AR and MR Curves under Perfect Competition
- Nature of Total Revenue Curve: In a perfectly competitive market, the TR curve starts from the origin and rises steadily upward to the left at a constant rate as quantity sold increases. Since the price of the good is fixed, the TR curve moves progressively upward from the origin in a straight line.
- Nature of Average Revenue Curve: In a perfectly competitive market, no buyer or seller can change the fixed market price. Since the price is constant, the AR curve is a horizontal straight line parallel to the X-axis.
- Nature of Marginal Revenue Curve: Because the price is constant in a perfectly competitive market, Marginal Revenue and Average Revenue are equal to each other. No matter how much quantity is sold, MR does not change. Therefore, MR is also equal to AR and runs parallel to the X-axis, overlapping the AR curve.
(C) Monopoly Market and Revenue Curves
The word “Monopoly” comes from two Greek words: monos (meaning single/alone) and polein (meaning to sell). Therefore, a market controlled by a single seller or a group of sellers is called a monopoly market. In other words, a monopoly market is a market structure in which there is only one producer and seller but a large number of buyers. In such a market, there are no close substitutes for the goods produced by the seller. The firm has complete control over the market for its product. To sell a larger quantity, the monopolist must progressively lower the price per unit. Entry of other firms into such a market is completely restricted.
According to A. Koutsoyiannis: “Monopoly is the market structure in which there is a single seller, there is no close substitute for the product it produces, and there are barriers to entry.”
A market structure with all these features perfectly does not exist in the real world. For example, organisations like the Nepal Electricity Authority and Nepal Oil Corporation are similar to monopoly markets within the context of Nepal.
Features of the Monopoly Market
- Single Seller: There is only one seller or producer who produces and sells goods and services in a monopoly market. All other producers or firms are prohibited from entering the market.
- Absence of Close Substitutes: There are no close substitute goods in this type of market. No alternative product is available in the market that can be used in place of the monopolist’s good. As a result, buyers have no choice and are compelled to purchase the good at the price set by the monopolist.
- Barriers to Entry: New firms are completely prohibited — either legally or technically — from entering the monopoly market.
- No Distinction between Firm and Industry: Since there is only one firm in the market, the firm and the industry are one and the same in a monopoly market.
- Price Maker: The monopolist firm itself determines the price of goods and services in the market. It is a price maker, not a price taker.
Revenue and Revenue Curves under Monopoly
In a monopoly market, the price of the good varies with the quantity sold. In order to sell a larger quantity, the seller must reduce the price per unit. As a result, Total Revenue initially rises, reaches a maximum at a certain point, and then falls. Average Revenue and Marginal Revenue both decline continuously, but MR falls at a faster rate than AR. Therefore, the MR curve lies below the AR curve.
The Total, Average, and Marginal Revenue curves under a monopoly market are presented in the diagram below.
Diagram 1.2: Revenue Curves under Monopoly Market
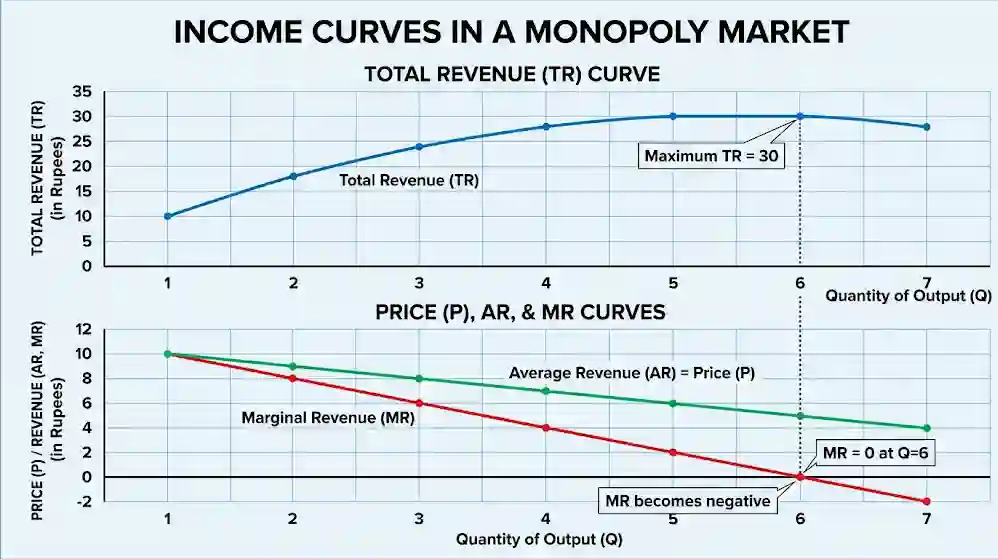
As shown in the diagram, the Total Revenue curve rises at a decreasing rate as the quantity sold increases, reaches a maximum point, and then falls. Both the Average Revenue and Marginal Revenue curves slope downward from upper-left to lower-right as the quantity sold increases. As they decline, the AR curve never touches the X-axis, but the MR curve crosses the X-axis and becomes negative.
Nature of TR, AR and MR Curves under Monopoly
- Nature of Total Revenue Curve: In a monopoly market, the TR curve starts from the origin, rises at a decreasing rate as quantity sold increases, reaches a maximum point, and then begins to fall.
- Nature of Average Revenue Curve: Since the price falls continuously in a monopoly market, the AR curve also falls continuously. It has a negative (downward) slope, moving from upper-left to lower-right.
- Nature of Marginal Revenue Curve: MR in a monopoly market also falls continuously like AR, but its rate of decline is steeper. It has a downward slope moving from upper-left to lower-right. As it falls, the MR curve crosses the X-axis and becomes negative.
2. Exercise (With Solutions)
Very Short Answer Questions [1 Mark]
Revenue per unit ($AR$) = $$\frac{TR}{Q} = \frac{5{,}000}{10} = \text{Rs. } 500$$
Marginal Revenue ($MR_4$) = $$TR_4 – TR_3 = 24 – 18 = \text{Rs. } 6$$
3. Short Answer Questions [5 Marks]
- Total Revenue (TR): The total amount received from selling the entire quantity of goods or services within a given period is Total Revenue. ($TR = P \times Q$)
- Average Revenue (AR): The revenue earned per unit of goods sold — obtained by dividing Total Revenue by the quantity sold — is Average Revenue. It is equal to the price (P) of the good. ($AR = \frac{TR}{Q}$)
- Marginal Revenue (MR): The additional change in Total Revenue that occurs when one extra unit of a good is sold is Marginal Revenue. ($MR = \frac{\Delta TR}{\Delta Q}$)
Total Revenue ($TR$) = $50 \times 100 = \text{Rs. } 5{,}000$
Average Revenue ($AR$) = $\frac{5{,}000}{50} = \text{Rs. } 100$
If selling the 51st chick raises TR to Rs. 5,100, then:
Marginal Revenue ($MR$) = $5{,}100 – 5{,}000 = \text{Rs. } 100$
- Large Number of Buyers and Sellers: The number of buyers and sellers transacting in the market is very large.
- Homogeneous Product: All firms produce goods of the same quality, size, and nature — the products are identical.
- Perfect Market Knowledge: Both buyers and sellers have complete knowledge of the market price and quality of goods.
- Free Entry and Exit: New firms are completely free to enter the industry and existing firms are free to exit at any time.
- No Government Intervention: Prices are determined entirely by the forces of market demand and supply; there is no government interference.
| Quantity Sold (Q) | Price (P) Rs. | Total Revenue (TR) Rs. | Average Revenue (AR) Rs. | Marginal Revenue (MR) Rs. |
|---|---|---|---|---|
| 1 | 10 | 10 | 10 | 10 |
| 2 | 10 | 20 | 10 | 10 |
| 3 | 10 | 30 | 10 | 10 |
| 4 | 10 | 40 | 10 | 10 |
| 5 | 10 | 50 | 10 | 10 |
| 6 | 10 | 60 | 10 | 10 |
Diagram:
Explanation: In drawing the curves, the TR line starts from the origin (0) and rises straight upward at a 45-degree angle. The AR and MR lines both start from the value 10 on the Y-axis and run as a single overlapping horizontal straight line parallel to the X-axis.
- Single Seller: There is only one producer or seller in the market, but buyers are many.
- Absence of Close Substitutes: No alternative product is available that can replace the monopolist’s good in the market.
- Barriers to Entry: Other new firms or producers are completely legally or technically prohibited from entering the market.
- No Distinction between Firm and Industry: Since there is only one firm, the firm itself is the entire industry.
- Price Maker: The monopolist sets the price of the good themselves; they are a price maker, not a price taker.
| Quantity Sold (Q) | Price (P) Rs. | Total Revenue (TR) Rs. | Average Revenue (AR) Rs. | Marginal Revenue (MR) Rs. |
|---|---|---|---|---|
| 1 | 20 | 20 | 20 | 20 |
| 2 | 18 | 36 | 18 | 16 |
| 3 | 16 | 48 | 16 | 12 |
| 4 | 14 | 56 | 14 | 8 |
| 5 | 12 | 60 | 12 | 4 |
| 6 | 10 | 60 | 10 | 0 |
| 7 | 8 | 56 | 8 | −4 |
Diagram:
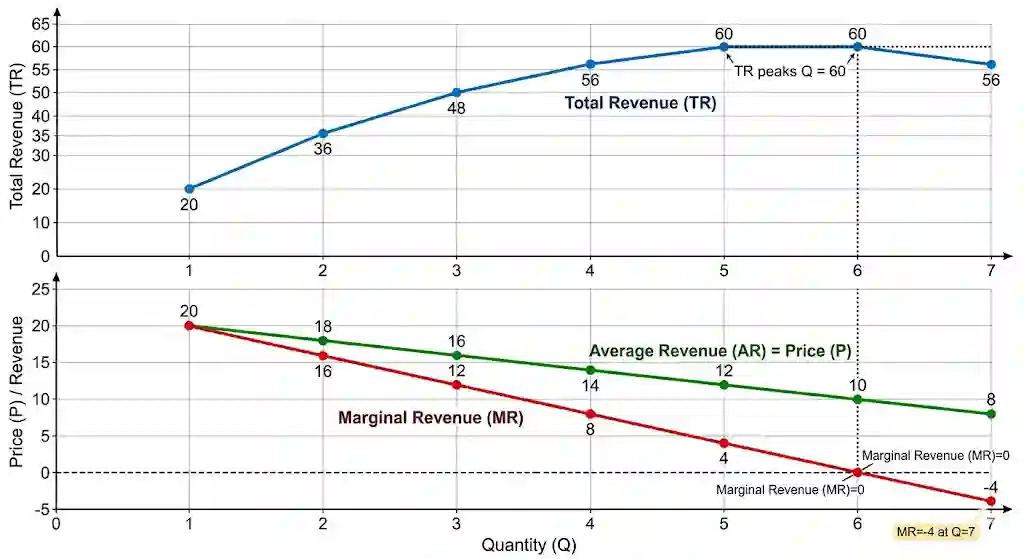
Explanation: The TR curve rises initially, reaches its maximum at the 6th unit (Rs. 60), and then falls. The AR and MR curves both slope downward from upper-left to lower-right. The MR curve falls more steeply than AR, crosses the X-axis at the 6th unit, and becomes negative (−4) at the 7th unit.
4. Long Answer Questions [8 Marks]
- Total Revenue (TR) Curve: This curve starts from the origin and rises as a straight line at a constant rate, moving steadily upward to the right.
- Average Revenue (AR) and Marginal Revenue (MR) Curves: Since the price is constant, both AR and MR are horizontal straight lines parallel to the X-axis, and they overlap each other completely.
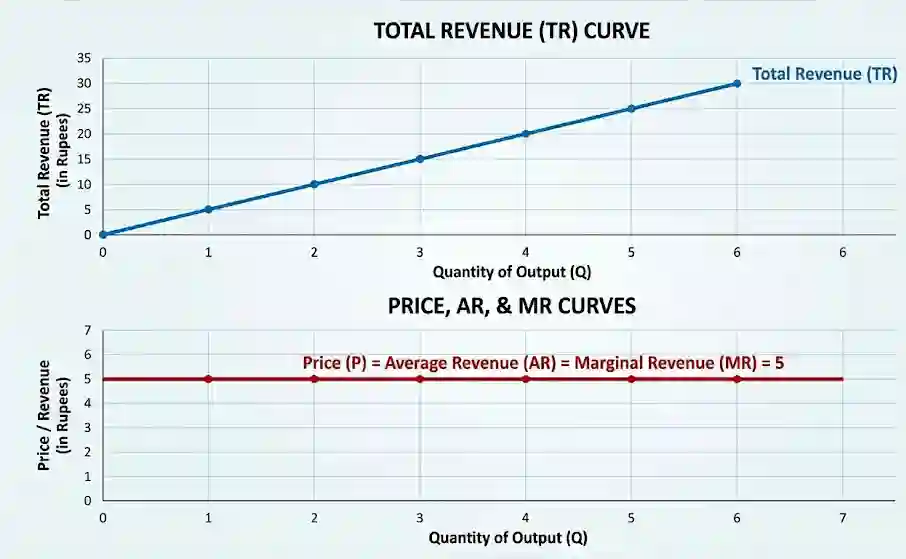
Diagram:
| Quantity Sold (Q) | Price (P) Rs. | Total Revenue (TR) Rs. | Average Revenue (AR) Rs. | Marginal Revenue (MR) Rs. |
|---|---|---|---|---|
| 1 | 5 | 5 | 5 | 5 |
| 2 | 5 | 10 | 5 | 5 |
| 3 | 5 | 15 | 5 | 5 |
| 4 | 5 | 20 | 5 | 5 |
| 5 | 5 | 25 | 5 | 5 |
| 6 | 5 | 30 | 5 | 5 |
Diagram:
Nature of the Revenue Curves:
- Nature of Total Revenue (TR) Curve: As the quantity sold increases, TR increases by Rs. 5 each time, at a constant rate. Therefore, the TR curve starts from the origin and rises upward as a straight line (upward sloping) at a steady constant rate.
- Nature of Average Revenue (AR) and Marginal Revenue (MR) Curves: Since the price is constant, both AR and MR remain equal (Rs. 5). Therefore, the AR and MR curves appear as a single horizontal straight line parallel to the X-axis, overlapping each other completely.
Table (Monopoly Market):
| Quantity Sold (Q) | Price / Average Revenue (AR) Rs. | Total Revenue (TR) Rs. | Marginal Revenue (MR) Rs. |
|---|---|---|---|
| 1 | 10 | 10 | 10 |
| 2 | 9 | 18 | 8 |
| 3 | 8 | 24 | 6 |
| 4 | 7 | 28 | 4 |
| 5 | 6 | 30 | 2 |
| 6 | 5 | 30 | 0 |
| 7 | 4 | 28 | −2 |
Diagram:
Nature of the Curves (Explanation):
- Total Revenue (TR) Curve: From the table, TR rises from 10 to 18, 24, and onwards, reaching a maximum of 30 at the 5th and 6th units. At the 7th unit, lowering the price causes TR to fall back to 28. Therefore, in the diagram, the TR curve rises upward to its maximum point and then falls back down.
- Average Revenue (AR) Curve: Since the price must be reduced to sell more, the AR curve has a downward (negative) slope moving from upper-left to lower-right. It never becomes zero or negative.
- Marginal Revenue (MR) Curve: The MR curve also slopes downward like the AR curve, but at a steeper rate — so it always lies below AR. At the 6th unit, MR reaches zero, where the curve touches the X-axis. At the 7th unit, MR becomes negative (−2), so the MR curve crosses the X-axis and continues downward below it.
5. Additional Solved Numerical Problems
Conceptual and Numerical Questions
Solved Numerical Problems
Problem 4: If a firm earns Total Revenue of Rs. 3,000 by selling 20 units of a good, find the Average Revenue.
Total Revenue ($TR$) = Rs. 3,000 | Quantity sold ($Q$) = 20
$$AR = \frac{TR}{Q} = \frac{3{,}000}{20} = \text{Rs. } 150$$ ∴ Average Revenue = Rs. 150
Problem 5: A seller earns Rs. 2,000 from selling 10 bags. Selling 12 bags raises TR to Rs. 2,240. Find the Marginal Revenue.
$TR_1$ = Rs. 2,000 | $Q_1$ = 10
$TR_2$ = Rs. 2,240 | $Q_2$ = 12
$\Delta TR = 2{,}240 – 2{,}000 = \text{Rs. } 240$
$\Delta Q = 12 – 10 = 2$
$$MR = \frac{\Delta TR}{\Delta Q} = \frac{240}{2} = \text{Rs. } 120$$ ∴ Marginal Revenue = Rs. 120
Problem 6: A firm sells 40 apples and earns Rs. 2,000. Find the Average Revenue.
$TR$ = Rs. 2,000 | $Q$ = 40
$$AR = \frac{TR}{Q} = \frac{2{,}000}{40} = \text{Rs. } 50$$ ∴ Average Revenue = Rs. 50
Problem 7: Selling 20 mangoes earns TR = Rs. 400, and selling 21 mangoes earns TR = Rs. 1,600. Find the Marginal Revenue.
$TR_1$ = Rs. 400 | $Q_1$ = 20
$TR_2$ = Rs. 1,600 | $Q_2$ = 21
$\Delta TR = 1{,}600 – 400 = \text{Rs. } 1{,}200$
$\Delta Q = 21 – 20 = 1$
$$MR = \frac{\Delta TR}{\Delta Q} = \frac{1{,}200}{1} = \text{Rs. } 1{,}200$$ ∴ Marginal Revenue = Rs. 1,200
📚 Also Read: Class 10 SEE Notes
Compulsory Subjects
Optional Subjects